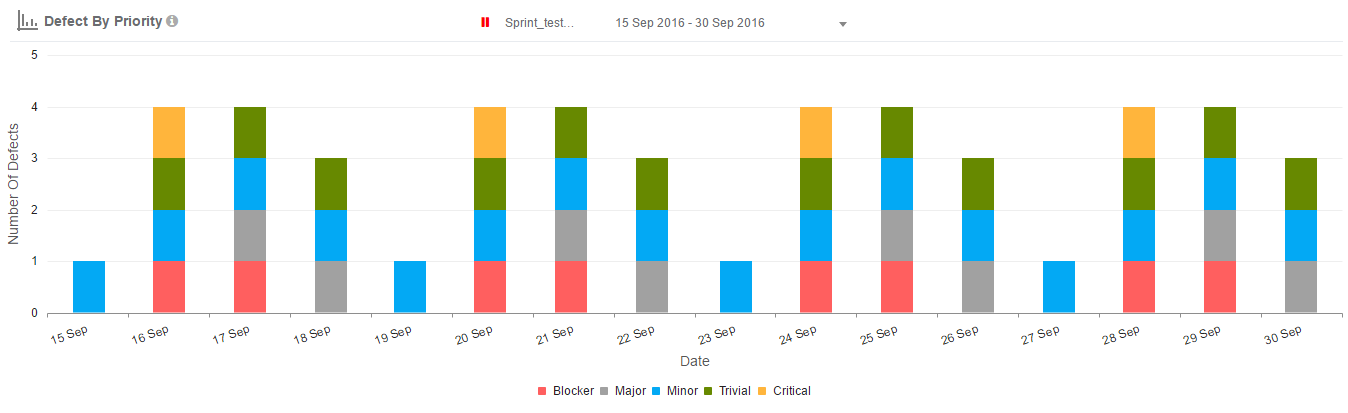
The Defects by Priority shows open defects by its priority over a selected time box. The chart takes the sprint as its time box. This chart can be generated for an individual team or for all team.
X – Axis: Days of Time Box.
Y – Axis: Number of Defects by priority in stacked manner.
1. The decrease or increase in a trend shows the submission or resolved rate of the defects by its priority each day.
2. The increase pattern for a particular priority is showing the less work done for the priority for a day and vice versa.
3. Each stack will signify the priorities of the Defect Stories.