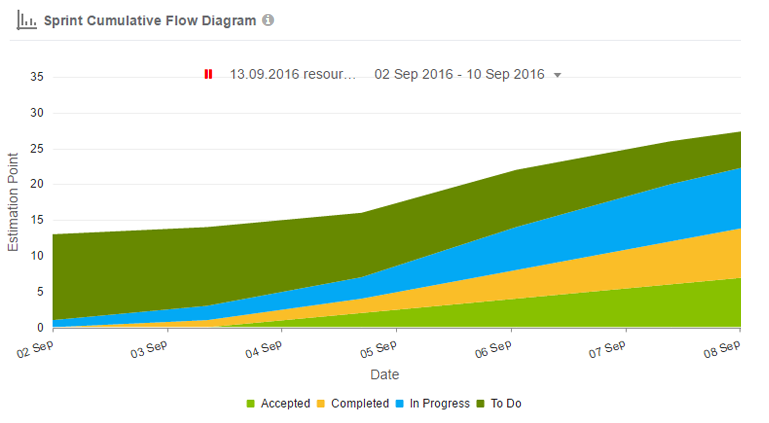
Sprint Cumulative Flow diagram is an area chart representing the amount of work in different status for the sprint. It is used by the person who is responsible for the sprint execution, to identify the bottlenecks, measuring lead time and how the WIP is changing over time.
X Axis – shows Dates of all the sprints.
Y Axis – shows all the Estimation Points of the selected sprint.
There are four defined areas shown in the cumulative chart:
1. To Do (Blue area): All user stories that are available in To Do status within a sprint.
2. In Progress (Orange area): All user stories that are available within In progress status in a sprint.
3. Completed (Green area): All user stories that are available in Completed status within a sprint.
4. Accepted (Teal area): All user stories that are available in Accepted status within a sprint.